Analytics without manual reports and data overload
You see only the metrics that affect decisions. No Excel files. No endless spreadsheets. No “which number is correct?”
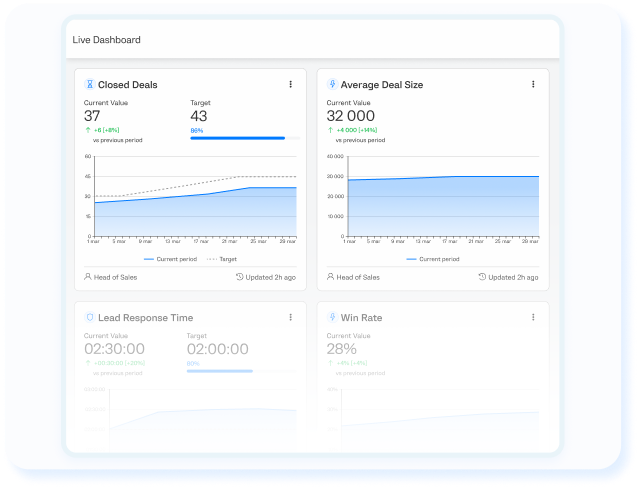
All key metrics are in one place.
Growth, stagnation or decline — you see it immediately.
The system detects deviations without constant monitoring.
Metrics are directly connected to OKR and responsibility.
Metric trend view
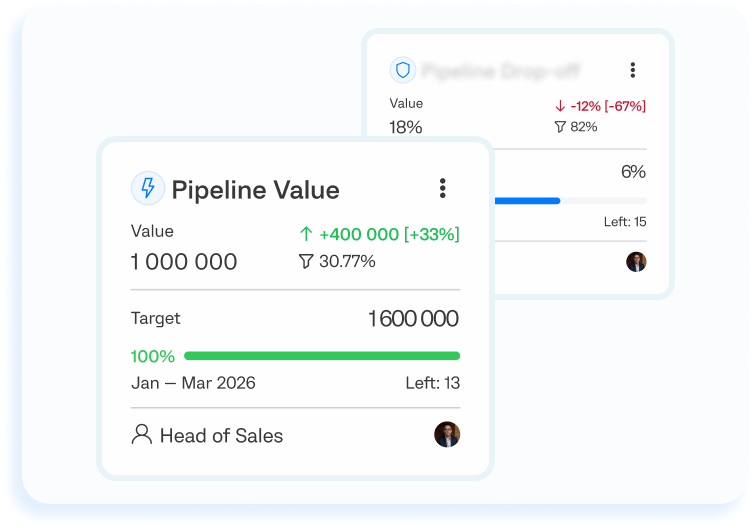
Each metric is shown as a clear card with a trend.
You instantly see metric changes, status and deviation from the target — without manual analysis and reporting.
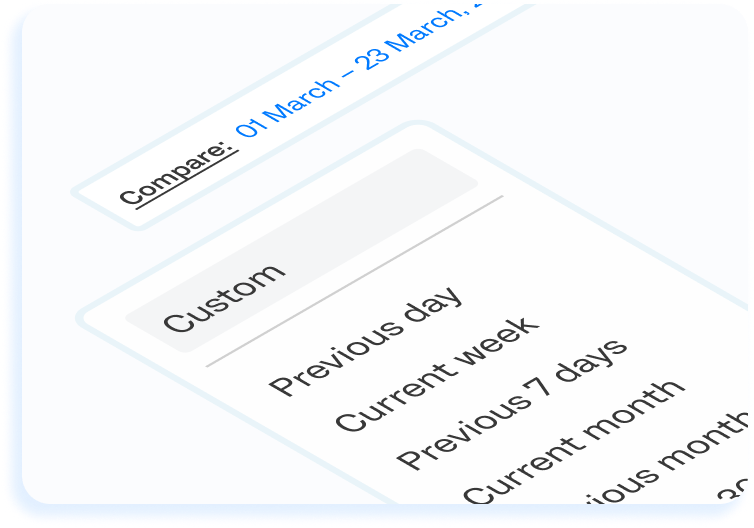
Period comparison
Compare results across different periods and quickly see growth or decline.
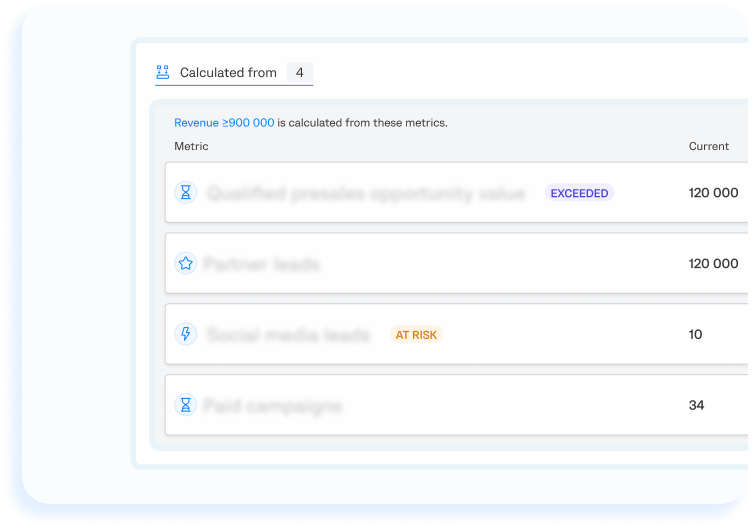
Metric in the context of a goal
Each metric is connected to a specific goal. You see how metric changes affect goal progress.
For the first time, we saw the full picture of our key metrics in one place. Decisions became faster and better grounded for the whole team.

FAQ
BI shows data.
Analytics in Enforcium shows the state of the business.
Metrics are connected to goals, responsibility and management decisions.
This is not just reporting — it is part of the business operating system.
Yes. You can start with a basic set of metrics.
But the most value appears when metrics are connected to goals and initiatives.
We recommend focusing on key metrics.
Analytics is designed for clarity, not overload.
Metrics are updated automatically based on integrations or manual input settings.
Business should be managed, not chaotic
Enforcium connects metrics, goals and responsibility in one system — so you manage results, not react to problems.